Magnetics
This section is about how to plot and analysis the magnetics data.
Inboard $B_{z}$
def plot_inboard_B_z(shot)# 영역에 따라 분류

    Index_inBz = np.where(ods['magnetics.b_field_pol_probe.:.position.r']<0.09)
    Index_outBz = np.where(ods['magnetics.b_field_pol_probe.:.position.r']>0.795)
    Index_sideBz = np.where(np.abs(ods['magnetics.b_field_pol_probe.:.position.z']) > 0.8)
    Index_inFlux = np.where(ods['magnetics.flux_loop.:.position.0.r'] < 0.15)
    Index_OutFlux = np.where(ods['magnetics.flux_loop.:.position.0.r'] > 0.5)

    # Required to add reconstructed measured flux, field calculated by eddy current solver
    # Required to add reconstructed measured

    # Inboard B filed pol probe (pickup coil)
    n_rows = 9
    fig, axs = plt.subplots(n_rows, 3, figsize=(12, 3*n_rows))

    for i, ax in zip(Index_inBz[0], axs.flatten()):
        radial = ods[f'magnetics.b_field_pol_probe.{i}.position.r']
        vertical = ods[f'magnetics.b_field_pol_probe.{i}.position.z']
        position = '(' + str(radial) + ',' + str(vertical) + ')'
        ax.plot(ods['magnetics.time'], ods[f'magnetics.b_field_pol_probe.{i}.field.data'])
        ax.set_title(f'Inboard B Field Pol Probe at {position}')
        if i % 3 == 0:
            ax.set_ylabel("B Field [T]")
        if i >= 24:
            ax.set_xlabel("Time")

    plt.tight_layout()
    plt.show()

>>> import vest
>>> shot_39915 = vest.load(39915)
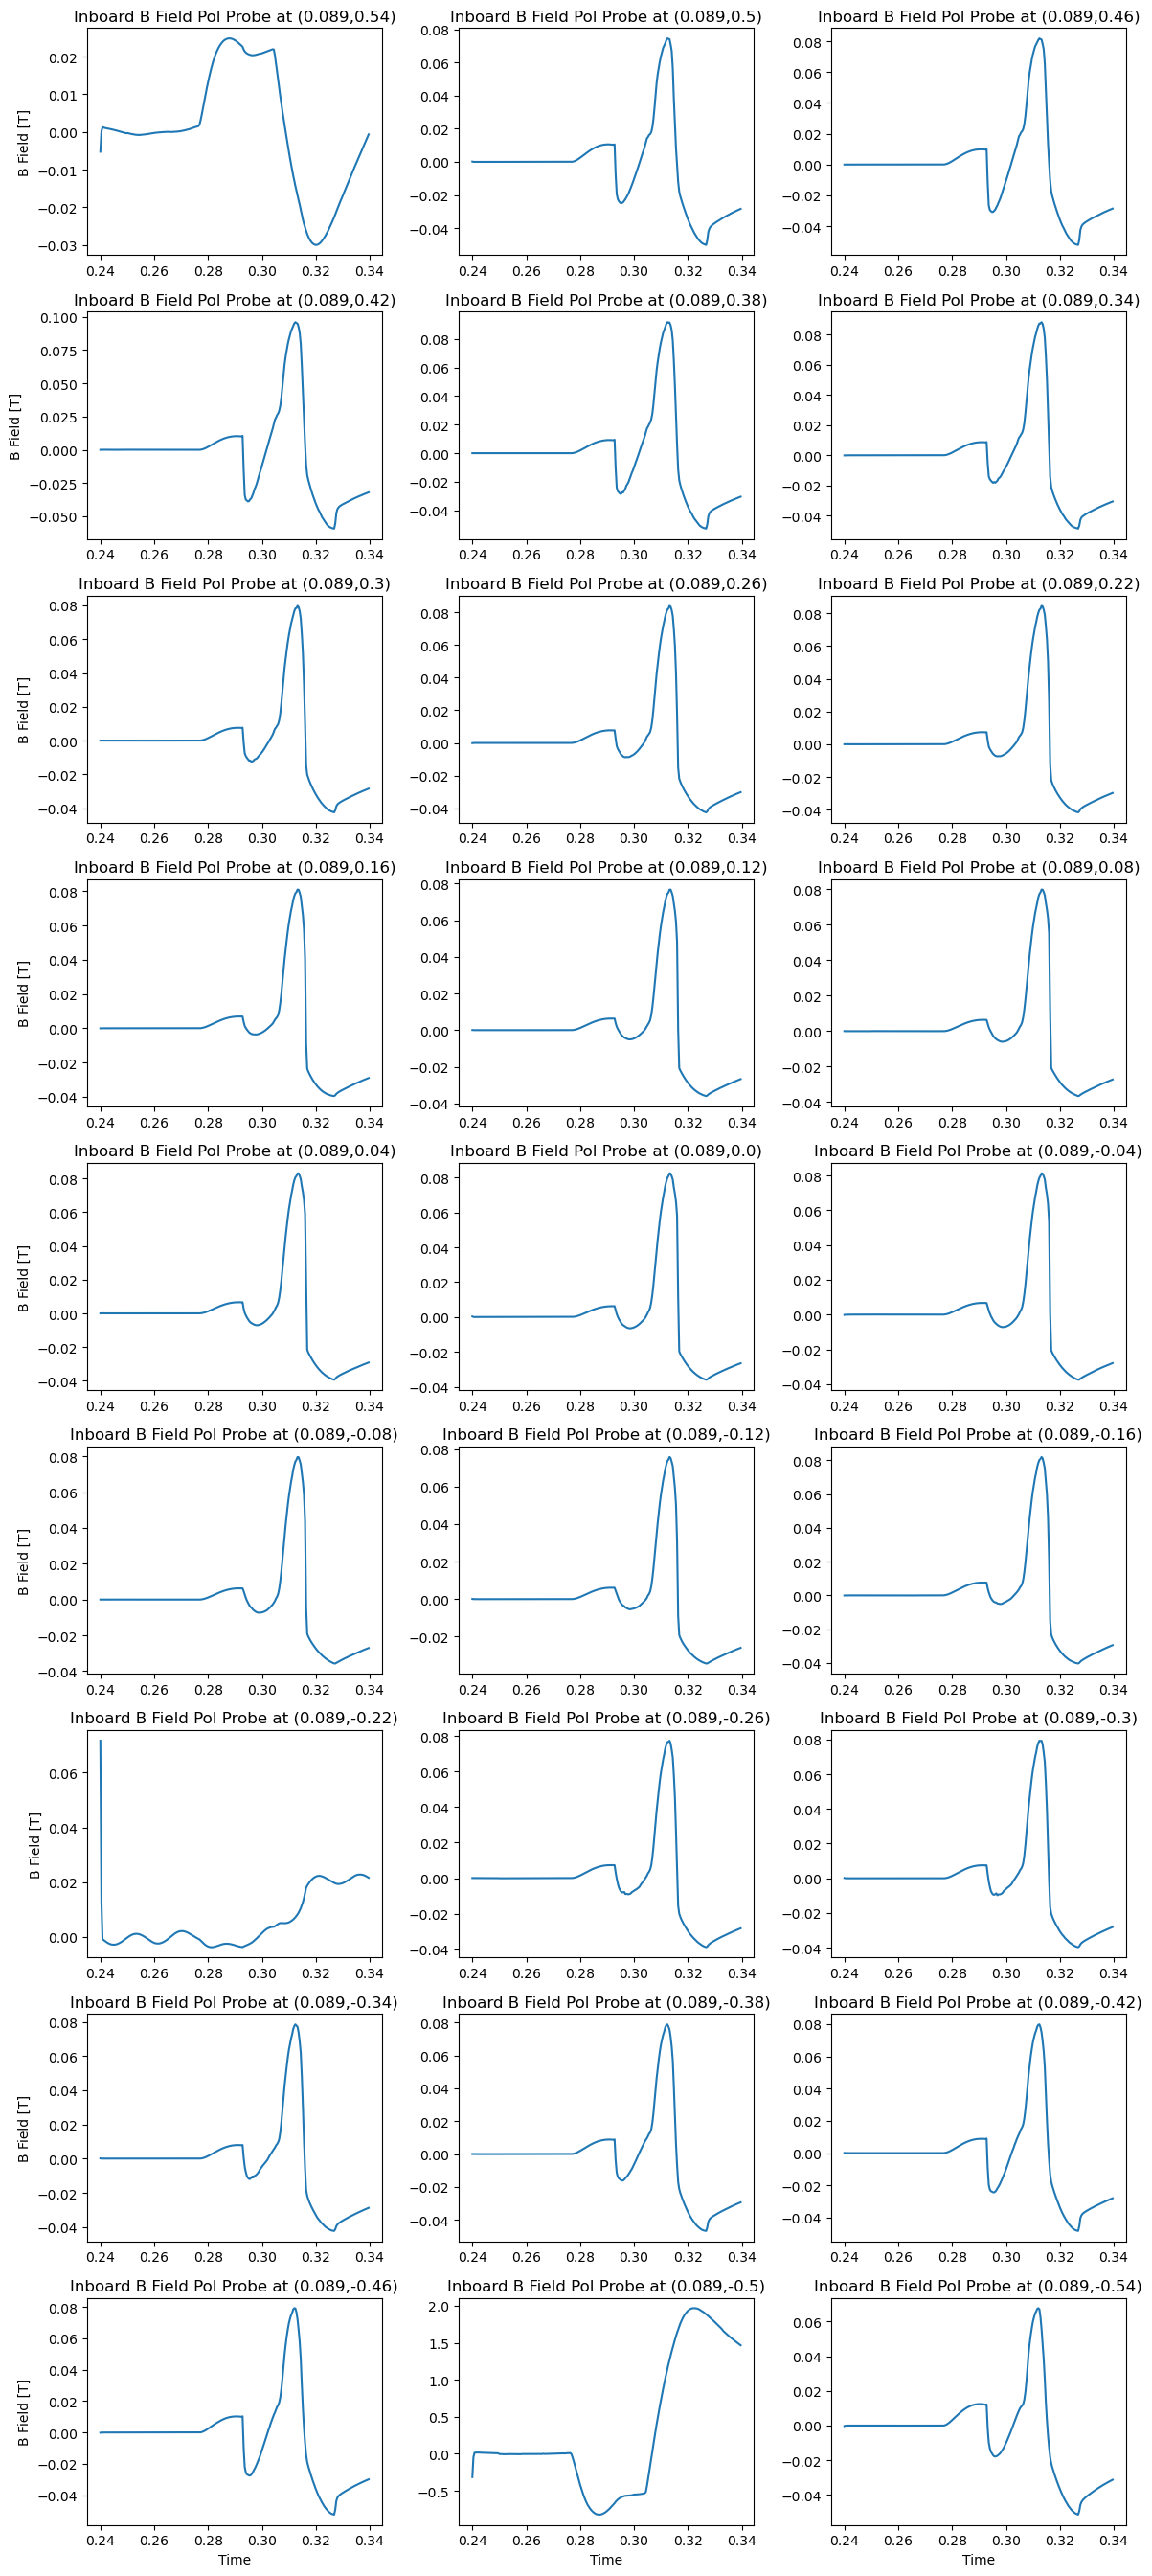
>>> vest.plot_inboard_B_z(shot_39915)
Outboard $B_{z}$
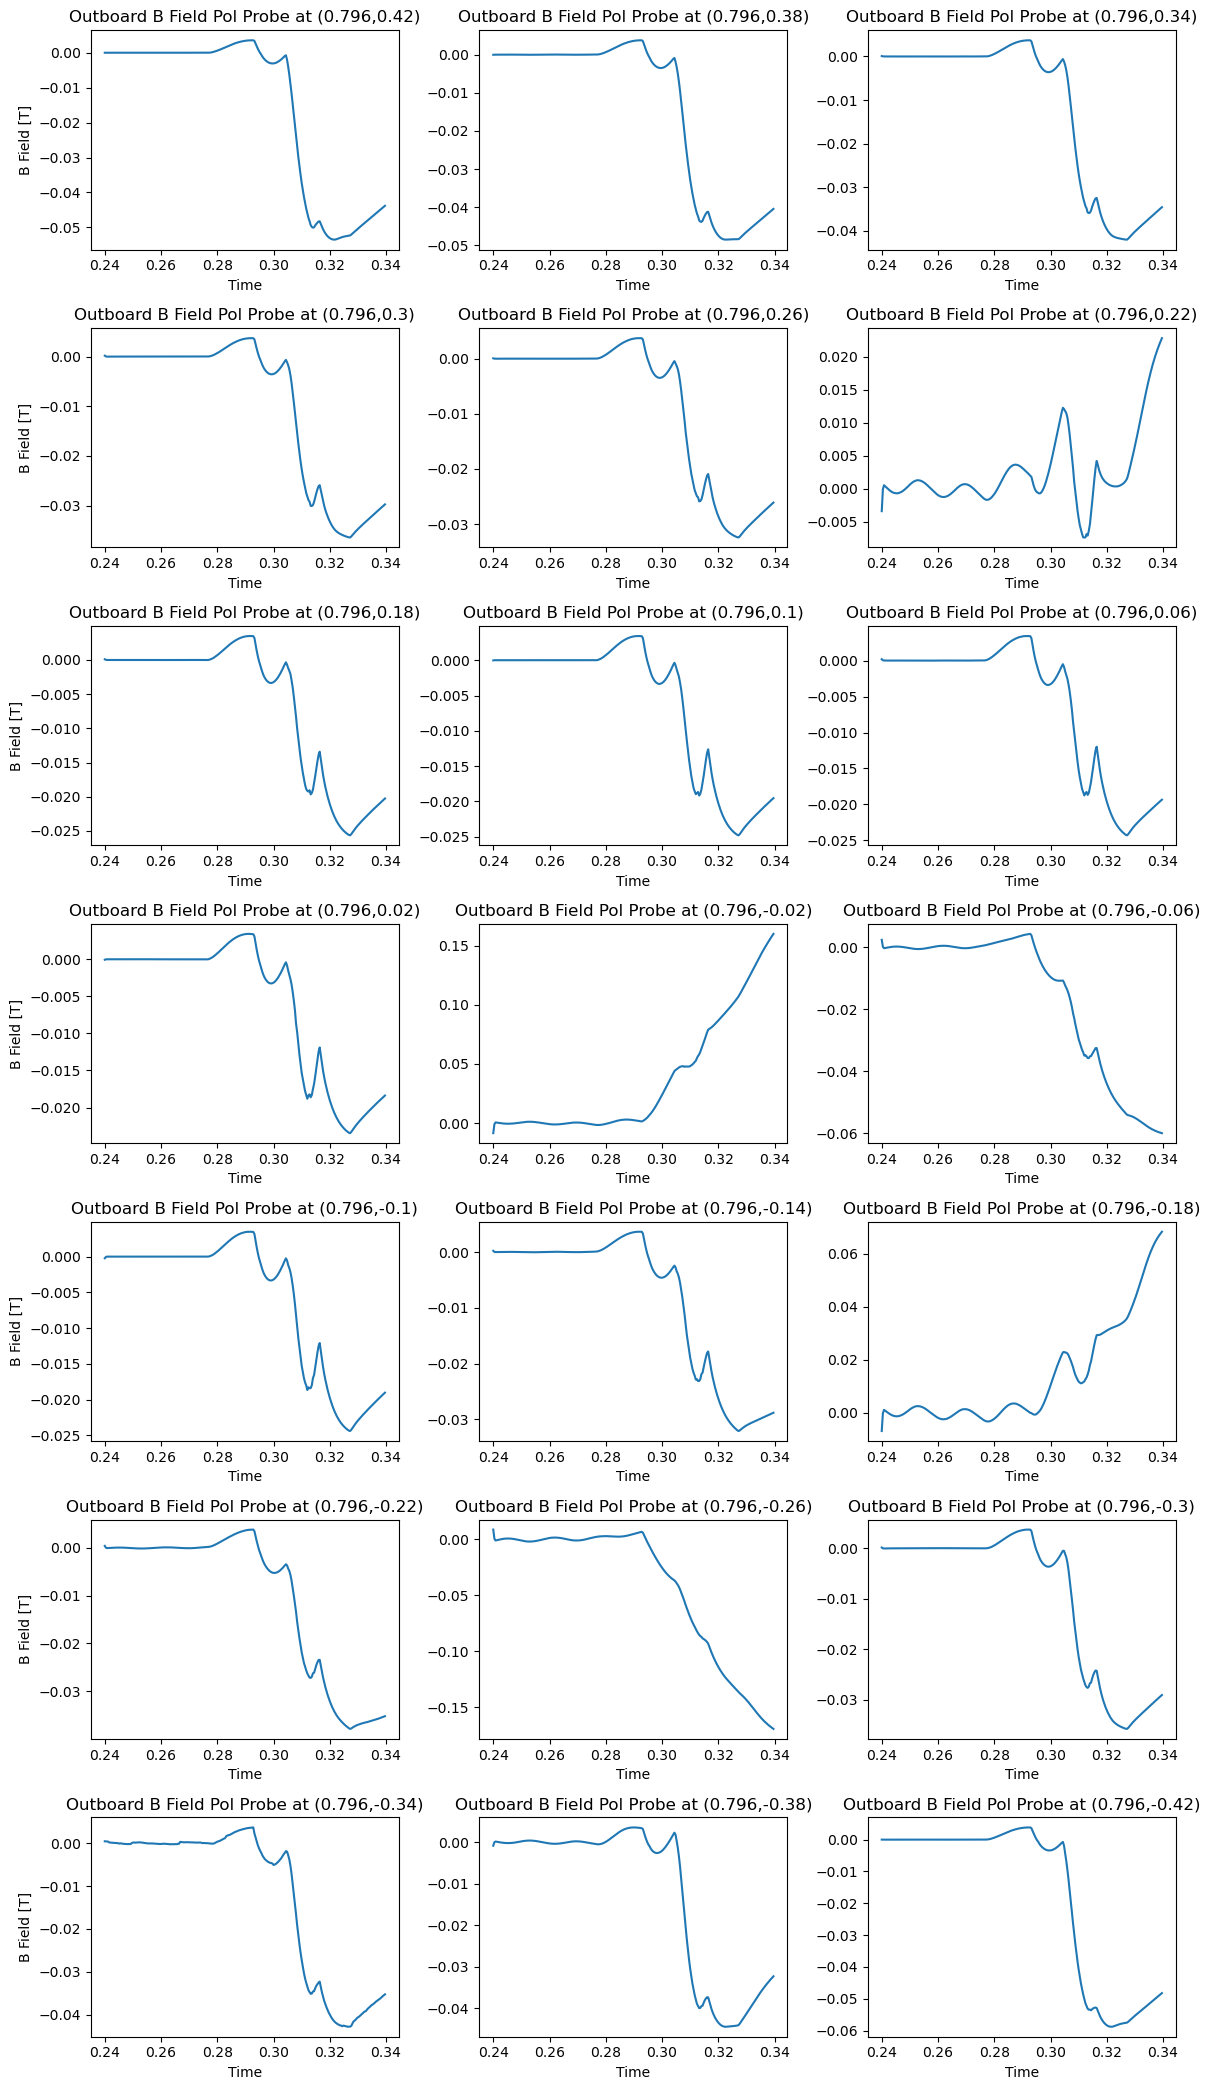
>>> vest.plot_outboard_B_z(shot_39915)
Side $B_{z}$
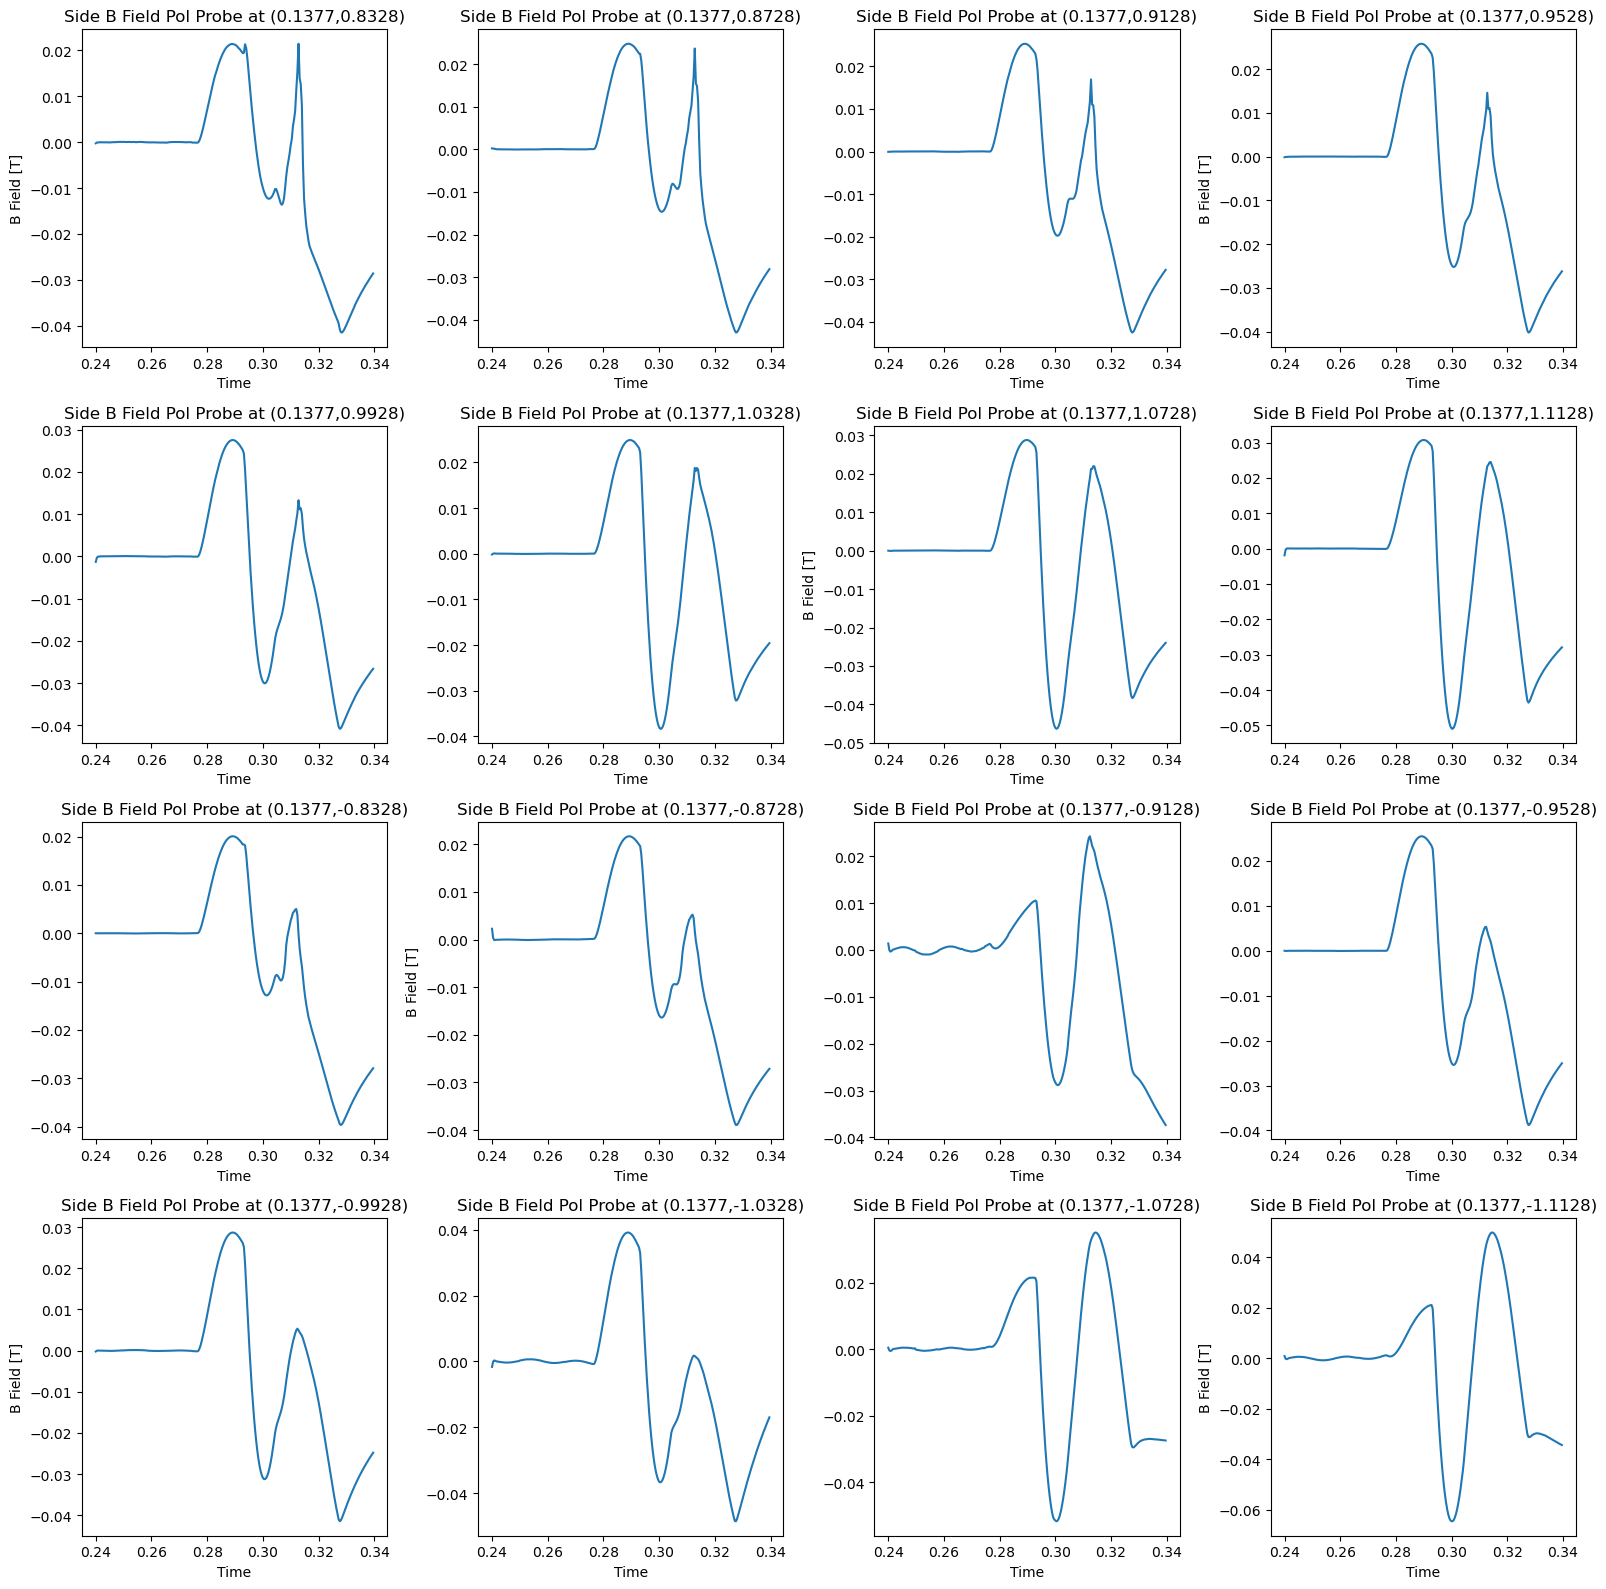
>>> vest.plot_side_B_z(shot_39915)
Inboard flux loop
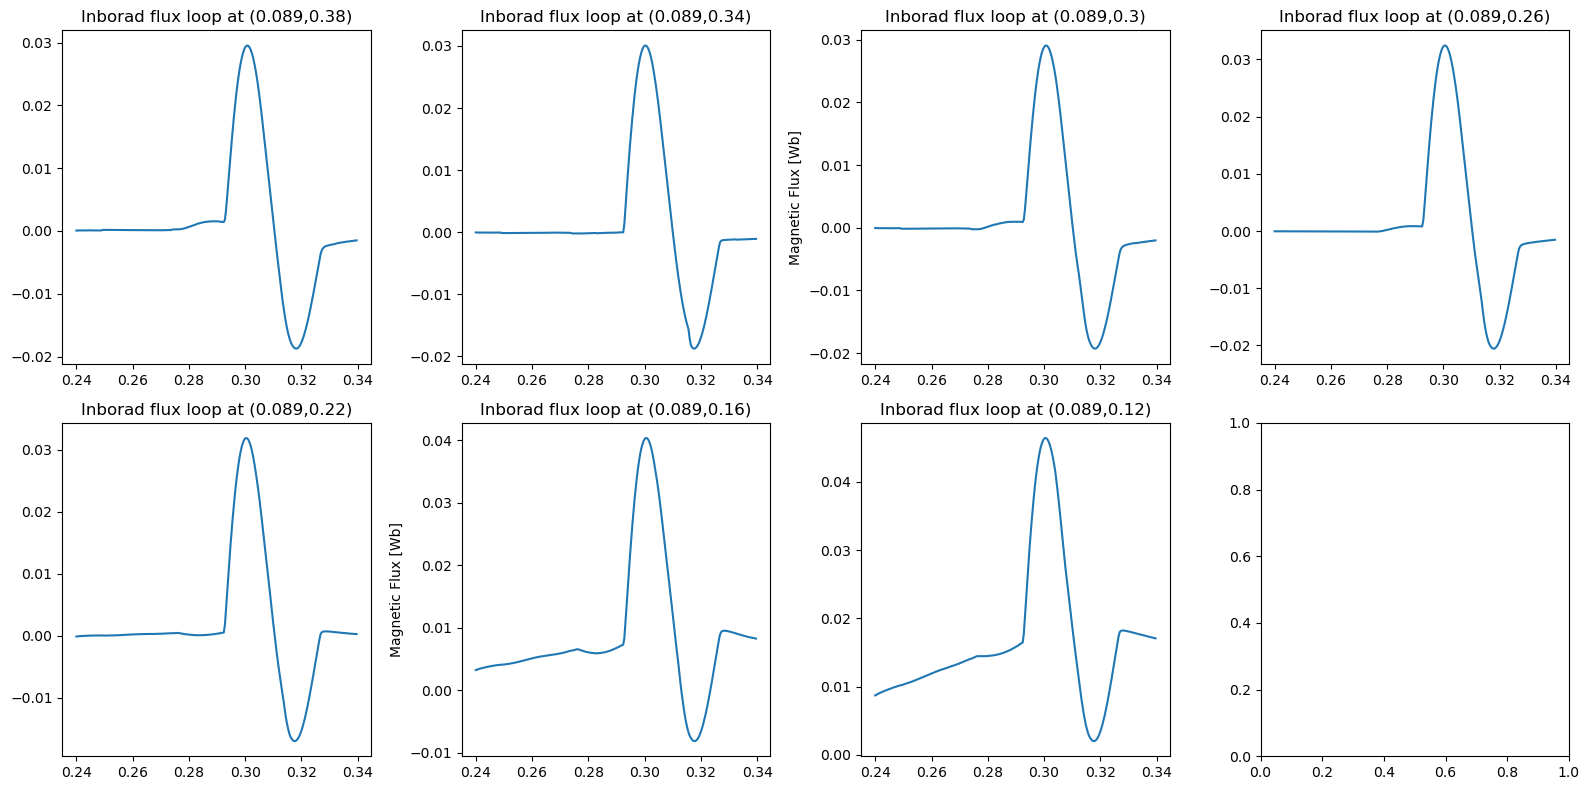
>>> vest.plot_inboard_flux_loop(shot_39915)
Outboard flux loop
>>> vest.plot_outboard_flux_loop(shot_39915)

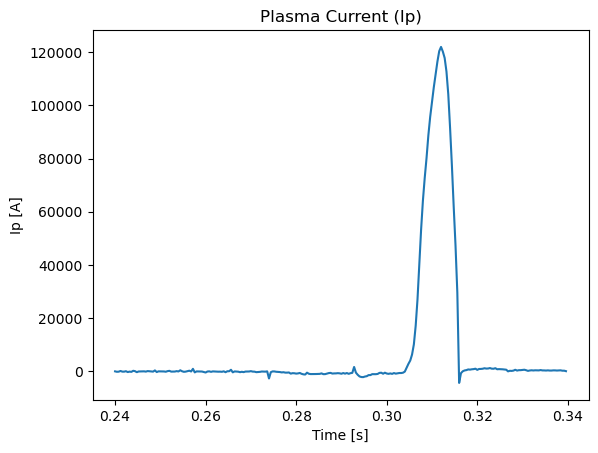
Plasma current
>>> vest.plot_plasma_current(shot_39915)
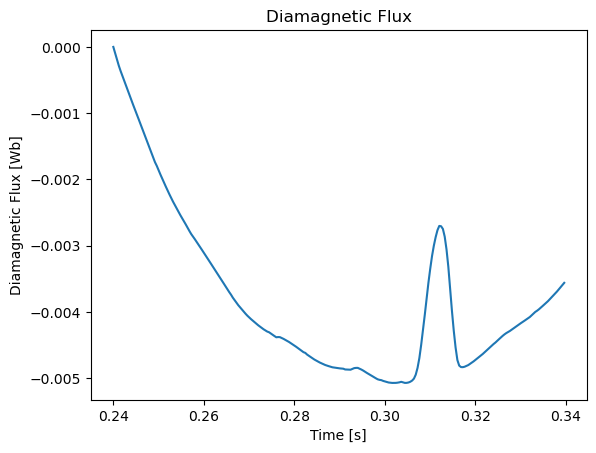
Diamagnetic Flux
>>> vest.plot_diamagnetic_flux(shot_39915)
Credit : Hongsik-yun (peppertonic18@snu.ac.kr)